Equipment dashboard
What is the Equipment dashboard?
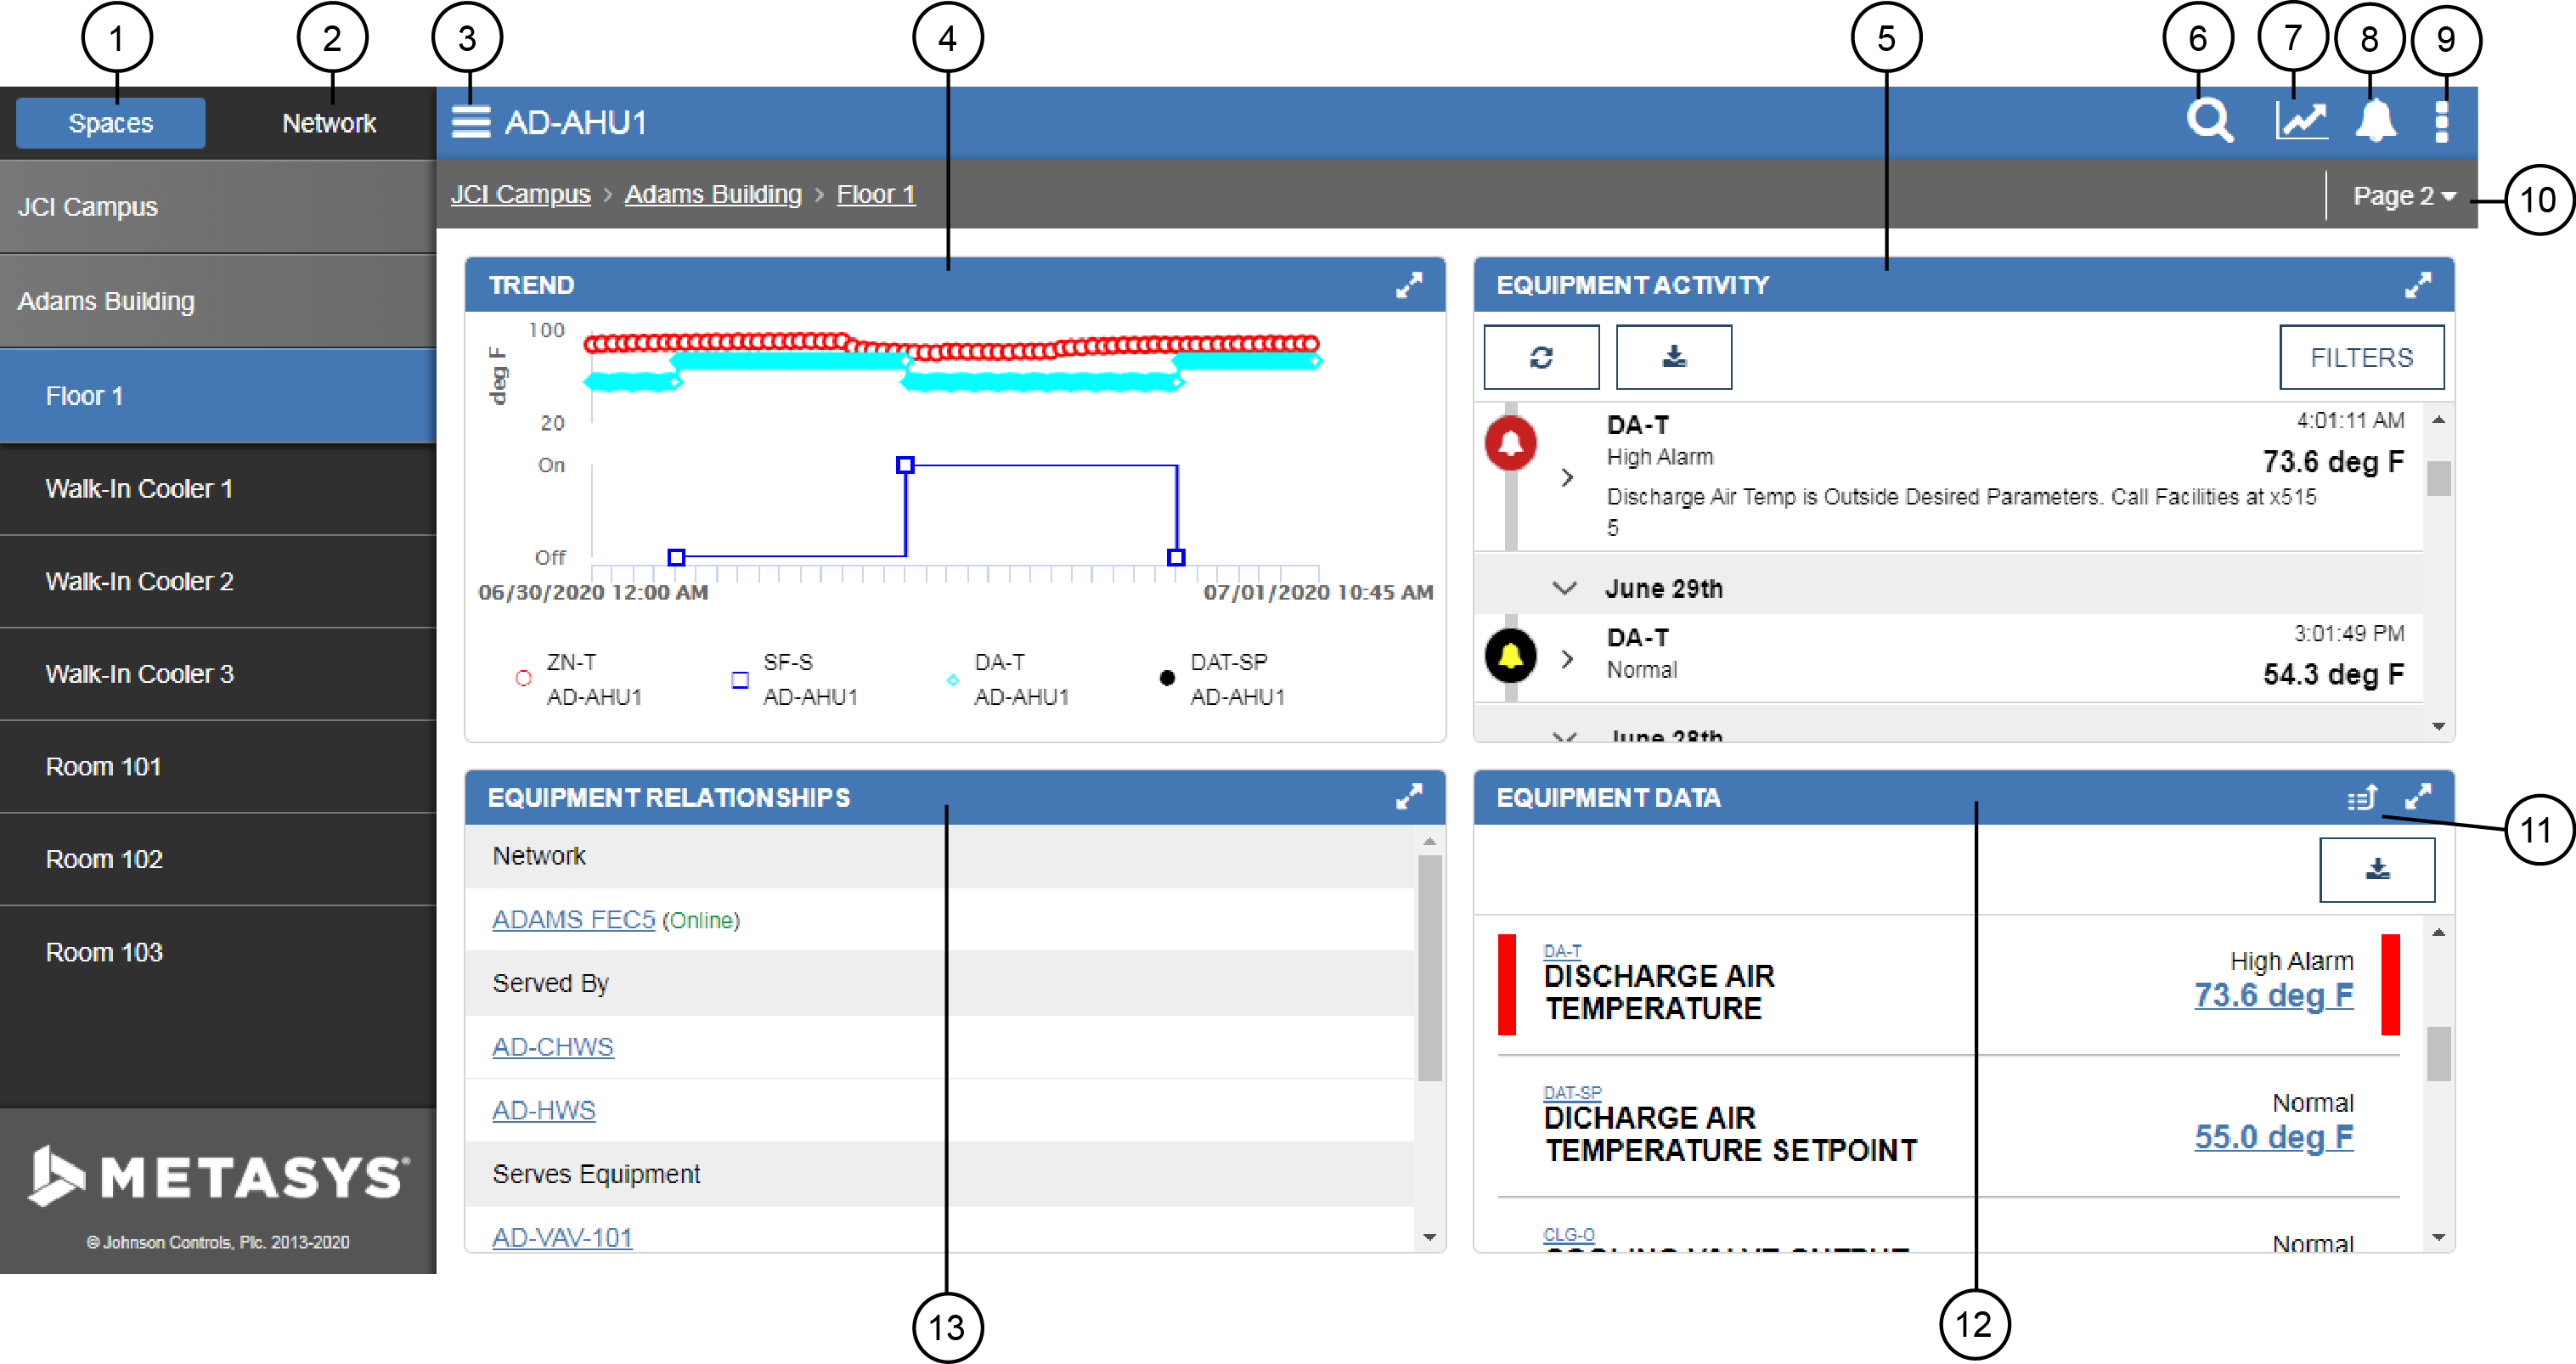
The Equipment dashboard provides a cohesive summary of a selected piece of equipment. Information displayed includes alarm history, user change history, equipment graphics, historical trend information, and relationships with other equipment and spaces.
How do I get to the Equipment dashboard?
To navigate to an Equipment dashboard, tap or click an equipment's name in a widget or a navigation button within a graphic in the Graphics widget. You can also search for a piece of equipment and tap or click the equipment's name in the search results.
Associated equipment object links are viewable from many places in the UI, including Alarm Manager. Anywhere there is a link to the equipment in the UI, it can be navigated to as long as the user has access.
When would I first see the Graphics widget on an Equipment dashboard?
If a graphic is configured for a piece of equipment, the default dashboard layout with the Graphics widget appears first. To see other widgets, use the Navigation page drop down in the header of the Metasys UI. The Graphics widget may not appear first, or be available at all, if a custom dashboard has been applied.
For more information on Custom Dashboards, see Dashboards Manager.
Where is the Schedule widget on an Equipment dashboard?
In the default dashboard layout for equipment, the Schedule widget appears after the Trend widget, the Equipment Activity widget, the Equipment Relationship widget, the Equipment Data widget, and the Graphics widget. To see other widgets, use the Navigation page drop-down in the header of the Metasys UI. If a custom dashboard has been applied, the schedule widget may appear in a different location, or not at all.
What is the default layout of the Equipment dashboard?

|
Number |
Name |
Description |
|---|---|---|
|
1 |
Navigation panel: Spaces tree tab |
Shows the Spaces tree and allows you to navigate through your spaces. |
|
2 |
Navigation panel: Building Network tree |
Shows the Building Network tree and allows you to navigate through your objects. |
|
3 |
Menu button |
Opens or closes the Navigation panel. |
|
4 |
Trend widget |
Displays a chart of historical equipment data for up to ten points at the same time. |
|
5 |
Equipment Activity widget |
Displays alarm activity and user changes made in the last year from the current date for a selected piece of equipment. You can acknowledge alarms, discard alarms, view audits, and view and add annotations from this widget. |
|
6 |
Search field |
Search for any space or equipment in your site. |
|
7 |
Custom Trend Viewer icon |
Displays historical trend data from any piece of equipment for up to ten points at the same time. |
|
8 |
Alarm icon |
Notifies you of new alarms that have occurred for points configured to equipment. The Alarm icon displays a red exclamation point for new alarms that have come in and not been acknowledged since you last viewed the Alarm Manager stand-alone (computer and tablet platforms) or the Alarm panel (phone platform). |
|
9 |
User menu |
Opens User menu options, including Advanced Search & Reporting, System Activity, Administrative Tasks, Help, My Profile, and Log Out. |
|
10 |
Page navigation drop-down |
Displays the page you are currently on. Click or tap the drop-down to navigate to a different page. |
|
11 |
View in icon |
Click or tap on the View in icon and select Advanced Search & Reporting to initiate an Advanced Search directly in the widget and thereby utilize auto-populated Advanced Search filters. |
|
12 |
Equipment Data widget |
Displays all points for the piece of equipment you are viewing to help you understand whether it is behaving normally. |
|
13 |
Equipment Relationships widget |
Displays all relationships the piece of equipment you are viewing has with other equipment, spaces, and network field controllers. you can easily navigate to other equipment or spaces to help troubleshoot issues. |
Is the Equipment dashboard supported on all devices?
Yes, the Equipment dashboard is supported on desktop, tablets, and smartphones.
