Alarm Manager and Alarm Monitor
What is the Alarm Manager and the Alarm Monitor?
You can view and take action on all alarms that occurred in your Metasys system with the Alarm Manager and the Alarm Monitor. See also What is the difference between Alarm Manager, Alarm Monitor, and Alarms list (also known as Alarm Announcement)?.
How do I access the Alarm Manager and the Alarm Monitor?
The Alarm Manager and Alarm Monitor are available on tablet and computer platforms, but they are not available on phone platforms.
Alarm Manager
To access the Alarm Manager viewer when you are logged in to the Metasys UI, tap or click the Alarm icon next to the User menu.
- In a supported browser, navigate to and log in to your Metasys UI site.
- Open a separate browser tab and navigate to https://[host name]/UI/alarms, where [host name] is replaced with the IP address or host name/server name of your Metasys Site Director.
Alarm Monitor
To access the Alarm Monitor, you do not need to log in to your Metasys UI site. Simply navigate to https://[host name]/UI/alarms, where [host name] is replaced with host name, server name, or IP address of your Metasys Site Director. However, an administrator user or the MetasysSysAgent user must first log in to the Metasys UI and enable the Alarm Monitor after installing the Metasys UI.
- Log in to the Metasys UI as an administrator user or the MetasysSysAgent user.
- Open the User menu.
- Tap or click Administrative Tasks.
- Tap or click Settings.
- Select the Enable Alarm Monitor check box in the General tab.
What information is displayed in the Alarm Manager and the Alarm Monitor?
- the status icon
- new alarm indicator
(
 )
) - the priority of the alarm
- the type of alarm
- the trigger value of the alarm
- the equipment the alarm occurred on (if the alarm is on equipment configured to the Metasys UI; if the alarm is from equipment not configured to the Metasys UI, this column is blank)
- the short name of a mapped point, or the user name for unmapped objects in alarm
- the space the equipment serves (if the alarm is on equipment configured to the Metasys UI; if the alarm is from equipment not configured to the Metasys UI, this column is blank)
- the number of occurrences of the alarm
- the time stamp of the latest occurrence
The Alarm Manager also displays an Alarm Summary for all the alarms in the system. The Alarm Summary includes a total alarm count, denoting the number of alarms unacknowledged and acknowledged, and a breakdown of the number of alarms per priority.
If you are not logged in to the Metasys UI, the Alarm Monitor displays the same information as the Alarm Manager. However, the Alarm Monitor does not display the space the equipment serves (if the alarm is on equipment serving a space configured to the Metasys UI), nor does it display equipment information.
- Ensure that you set the Acknowledgment Required filter in the Event Viewer of ADS/ADX to True for every alarm, so that it displays in the Event Viewer and subsequently in the Alarm Manager or Monitor. For more information about setting the Acknowledgment Required attribute refer to the Creating Extensions section in Metasys SMP Help (LIT-1201793).
- Alarms roll up on an object point basis. Additionally, if an object is in an offline alarm, the alarm details list displays all previous alarm occurrences raised on that object.
- Events that do not need acknowledgment do not show in the Alarm Manager.
What is the layout of the Alarm Manager and the Alarm Monitor?
The following figure displays the layout of the Alarm Manager, which has a similar layout as the Alarm Monitor.
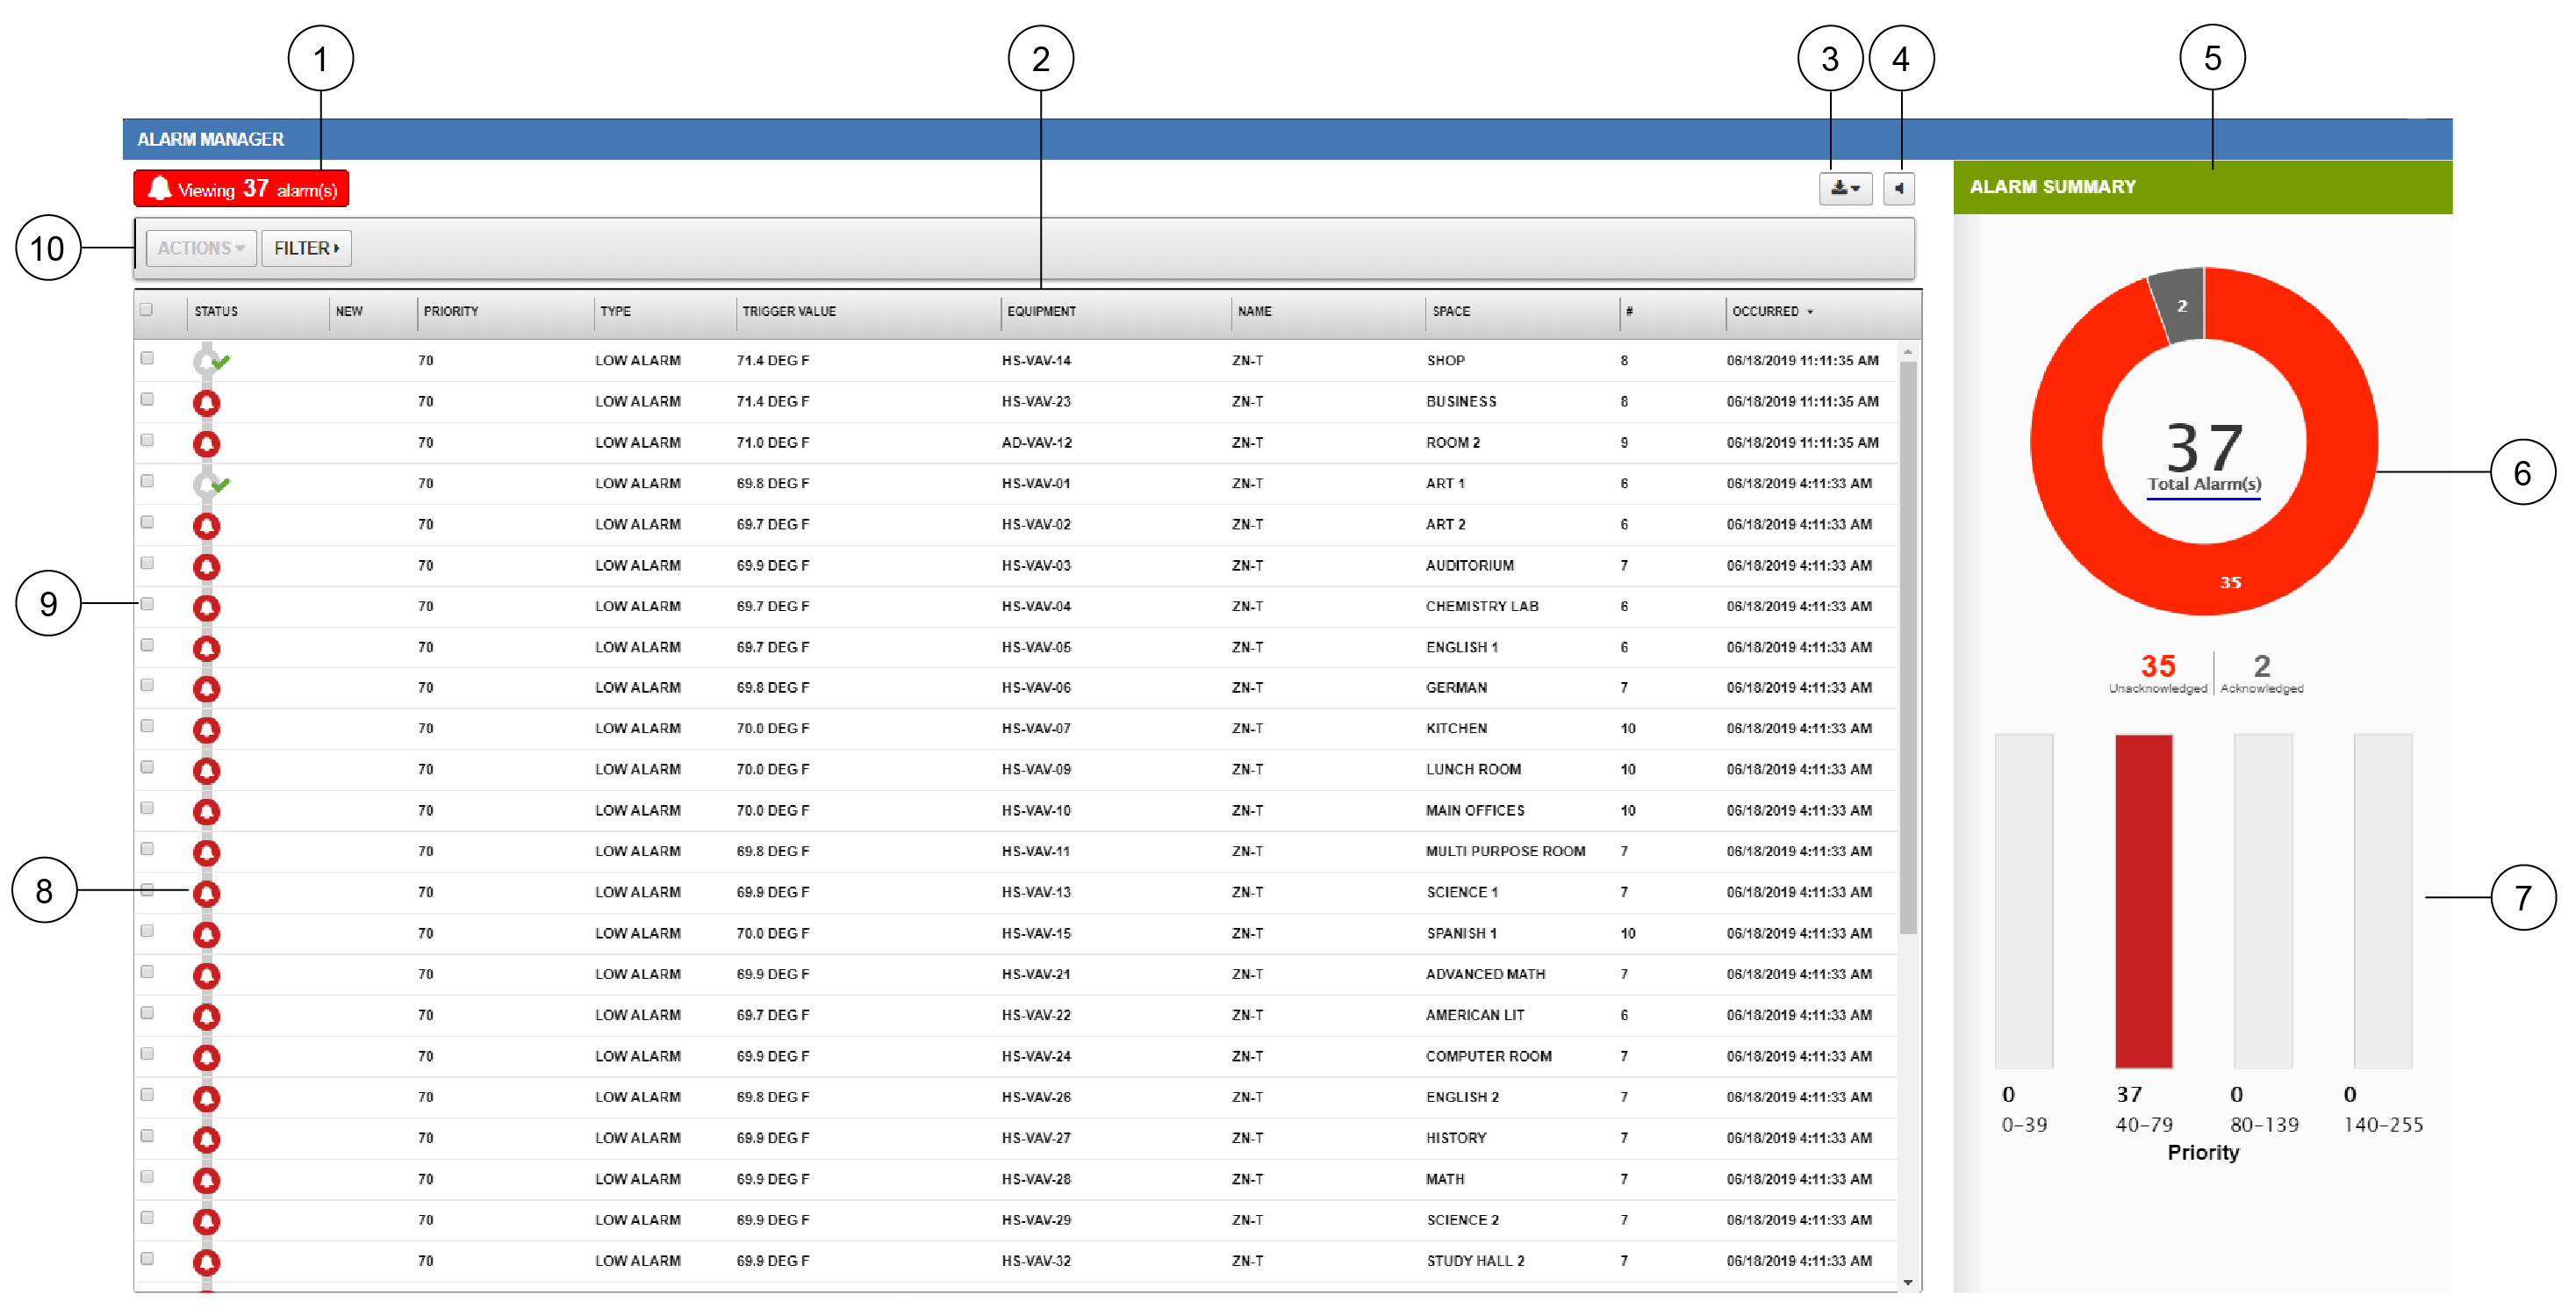
|
Number |
Name |
Description |
|---|---|---|
|
1 |
View alarm count |
Indicates the number of alarms currently being viewed. |
|
2 |
Alarms list and columns |
Shows the alarms, listed by:
|
|
3 |
Export icon |
Exports the raw list of alarms to a .csv file. Or exports a snapshot of the Alarm Summary charts and the list of displayed alarms in the alarms list to a .pdf file. Note: This icon is not available on tablets. The
.pdf export feature is
not available when you are not logged in.
|
|
4 |
Silence icon |
Silences current alarms. If a new alarm comes in while all existing alarms are silenced, the alarm sound plays until you acknowledge the alarm or silence the new alarm. |
|
5 |
Alarm Summary |
Displays the latest occurrences of alarms raised
on objects. Shows a count of total alarms in two charts: a
doughnut chart that displays the number of unacknowledged alarms
and acknowledged alarms, and a bar chart that displays the
number of alarms per priority.
Note:
Metasys UI currently supports up to six priority levels. If you have a 7th, 8th, and 9th alarm priority level, for example, you cannot see them in Metasys UI. |
|
6 |
Alarm Summary Doughnut Chart |
Displays a count of total alarms, including the number of unacknowledged alarms and acknowledged alarms. |
|
7 |
Alarm Summary Priority Bar Chart |
Displays the number of alarms pending acknowledgment for each priority. When you click on the bars, you apply the priority filter in the alarm details list. |
|
8 |
Alarm icon |
Indicates the alarm type and if the alarm was acknowledged. |
|
9 |
Alarm Selection Box |
Selects the alarm to display the detailed view or to perform an action (acknowledge or discard). If you select multiple alarms, you can perform batch acknowledgments or discards. |
|
10 |
Actions button Alarm Filter button |
Action Button: You can acknowledge or discard the selected alarms. Alarm Filter Button: Filters the alarms. Tap or click the filter
button to filter alarms by:
|
The following figure shows the Alarm Monitor. The layout of the Alarm Monitor differs only slightly from the Alarm Manager: the alarm list does not display space information, equipment information, or annotations, and a Log In button appears in the upper-right corner.
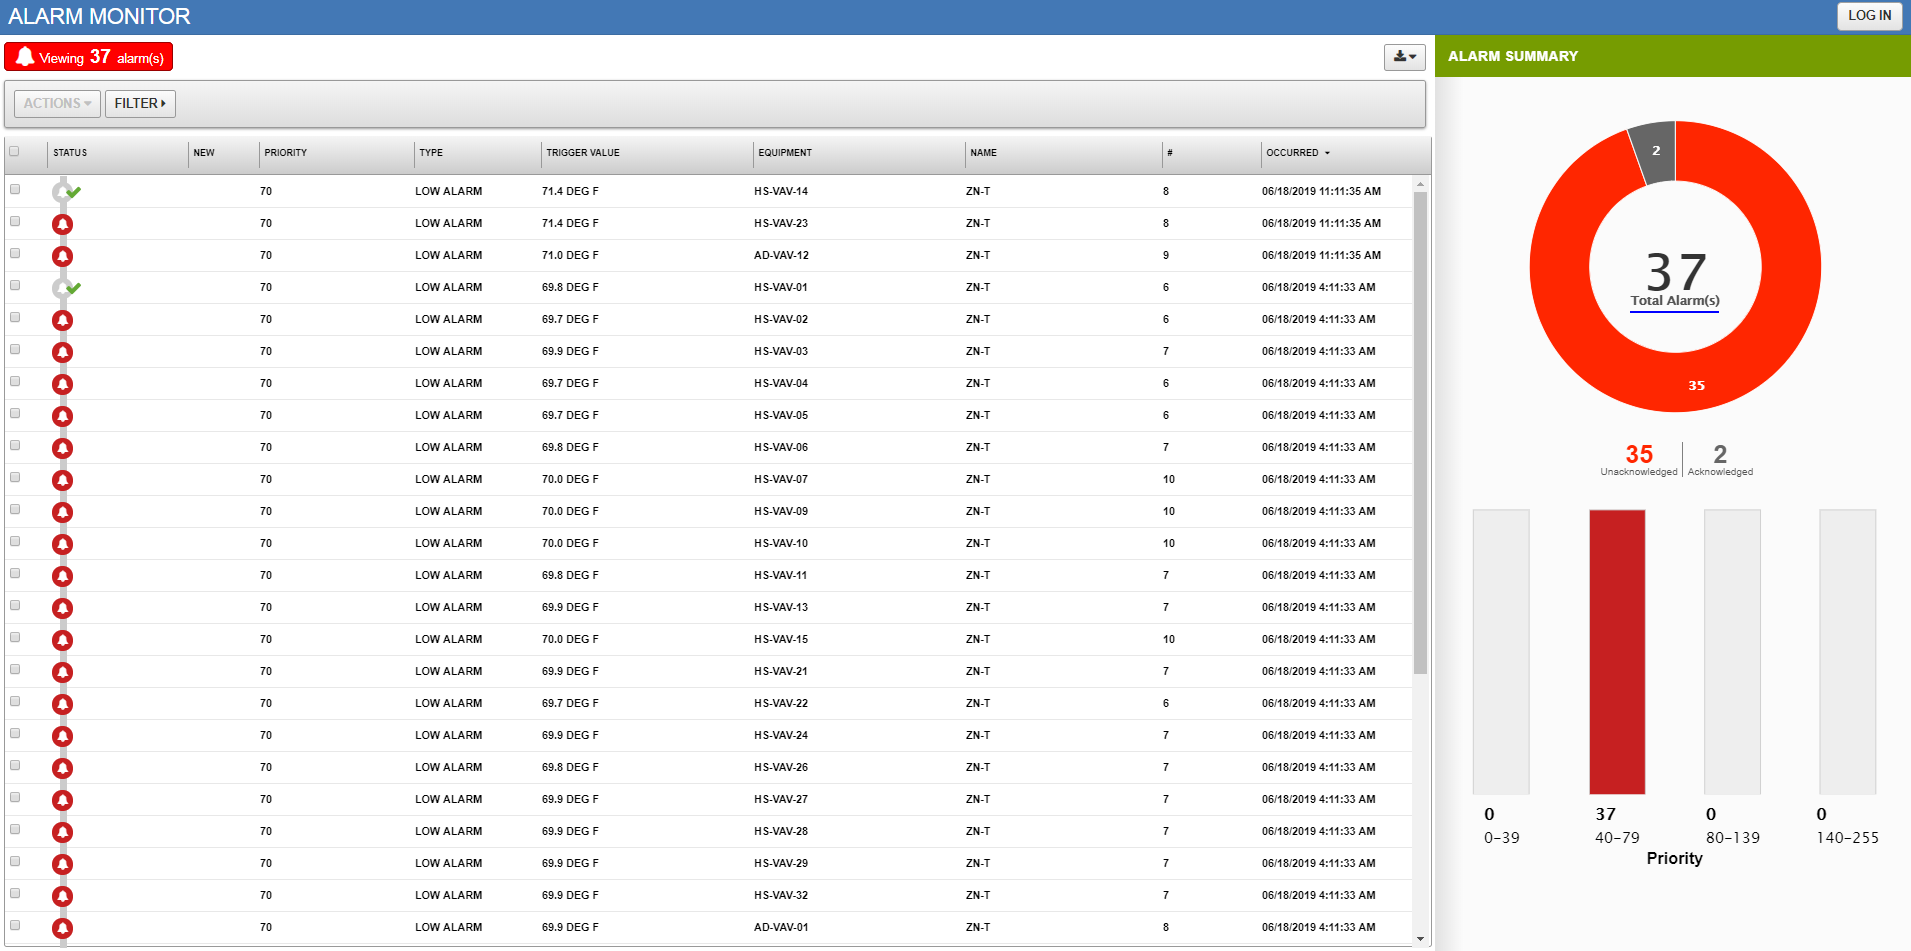
What information is displayed in the Alarm Summary?
The Alarm Summary displays the latest occurrences of alarms raised on objects.
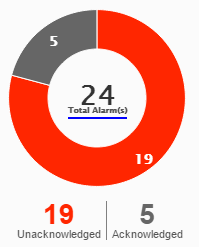
The Alarm Summary displays a count of total alarms, unacknowledged alarms, and acknowledged alarms in a doughnut chart.
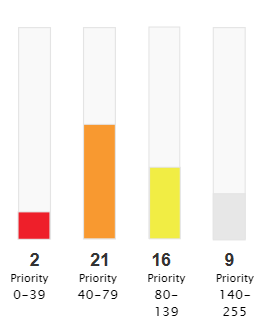
The Alarm Summary displays the number of alarms pending acknowledgment for each priority. You can tap or click the bar for a priority to filter the alarms list to the pending alarms for that priority.
How do I see a detailed view of an alarm?
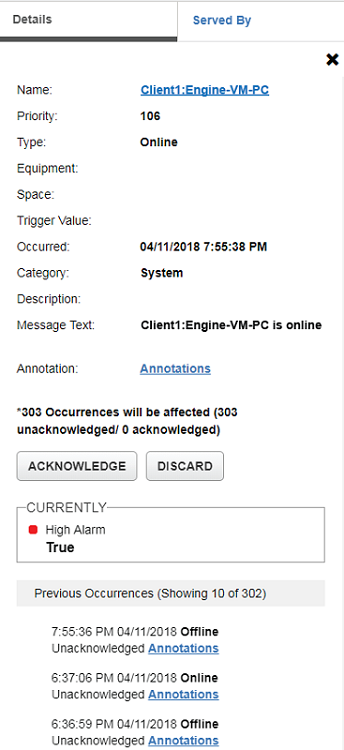
To see a detailed view of an alarm, tap or click on an alarm in the main area of the Alarm Manager or the Alarm Monitor. You can also see a detailed view of an alarm in the Alarms list on your phone platform.
- Name (short name of mapped points, or user name for unmapped objects in alarm).
- Priority
- Equipment
- Space
- For analog points, High Alarm Limit
and Low Alarm Limit values appear.
For binary or multistate points, Normal State and Alarm State values appear.
Note: High Alarm Limit and Low Alarm Limit or Normal State and Alarm State values are available for points only and are not available for device alarms. - Low Alarm Limit
- Trigger Value
- Occurred
- Category (authorization category of the object in alarm)
- Description (of the space or equipment affected by the alarm)
- Message Text (if any)
- Annotations
- ACKNOWLEDGE
and DISCARD buttons Note: There can be various types of alarms for one object. When you tap or click these buttons, you acknowledge or discard all of the rollup alarms for the object.
- Mapped objects are not hyperlinked.
- The hyperlink only works if you select the User Can View the Item Navigation Tree (Default Tree) property in your User Properties. For more information, refer to the Security Administrator System Technical Bulletin (LIT-1201528).
- Mapped objects are not hyperlinked.
- The Building Network Dashboard only opens if you select the User Can View the Item Navigation Tree (Default Tree) property in your User Properties. For more information, refer to the Security Administrator System Technical Bulletin (LIT-1201528).
- If you do not have View permission for an object, the login only takes you to the Building Network Dashboard of the object. You cannot view any details pertaining to the object.
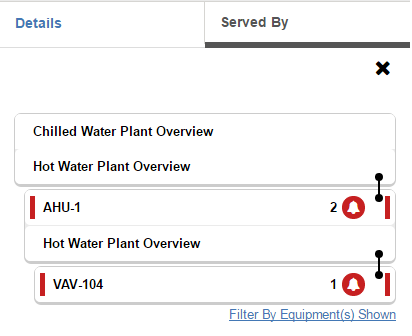
The Served By tab lists the equipment the alarm occurred on and the equipment upstream and downstream from the equipment the alarm occurred on. Tap or click the equipment name to filter the alarms list by the equipment selected. The numbers that appear next to the equipment denote the number of occurrences for an alarm on that piece of equipment.
What do the colors and icons mean for the alarms listed in the Alarm Manager and the Alarm Monitor?
The following table describes the alarm icons in the Alarm Manager and the Alarm Monitor.
|
Icon |
Description |
|---|---|
|
Appears for a Priority Level 1 or 2 alarm that requires acknowledgment. |
|
|
Appears for a Priority Level 3 or 4 alarm that requires acknowledgment. |
|
|
Appears for an alarm that has been acknowledged. |
The colors displayed in the Alarm Manager and Alarm Monitor are configured in the SMP Metasys System Preferences > Alarm Settings tab.
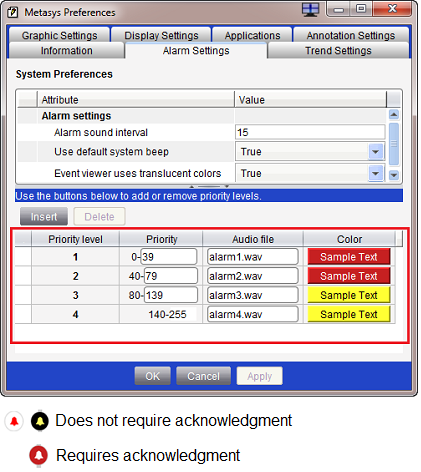
The colors of the alarm icons may be inverted from the preference colors. The inverted colors indicate whether the alarm requires acknowledgment.
Can I sort alarms listed in the main area of the Alarm Manager and the Alarm Monitor?
Yes. You can sort the Status, Priority, and Occurred columns of the list of alarms in ascending or descending alphanumeric order. To sort a column, tap or click the column header.
Can I filter the alarms listed in the main area of the Alarm Manager and the Alarm Monitor?
Yes, you can filter the alarms listed in the main area of the Alarm Manager and the Alarm Monitor.
- Priority: using a range of priorities, for example, 40 to 79
- Start Date to End Date: enter a date or range of dates to view alarms that occurred during the filtered time frame
- Alarm Status: Acknowledged and Unacknowledged
- Alarm Type: Select All, Normal, Fault, Off Normal, High Limit, Low Limit, Low Warning, High Warning, Alarm, Trouble, Status, Offline, Shutdown, Unreliable, Online, Above Setpoint, Below Setpoint, and Unoccupied
- Space & Equipment: search for alarms affecting space and equipment
- Point Category: Select All, HVAC, Fire, Security, Services, Administrative, General, Lighting, Refrigeration, Critical Environment, Air Quality, Power, Energy, System, and Custom
- Network Items: select space and equipment affected by alarms in the network tree
- Tap or click FILTER.
- Use one or several of the filter options.
- To filter alarms by Priority, enter a range of priorities.
- To filter alarms by a range of dates or a particular date, use the Start Date and End Date fields or calendar icons.
- To filter alarms by Alarm Status, select a status from the drop-down menu.
- To filter alarms by Alarm Type, select a type from the drop-down menu.
- To filter alarms by searching for alarms affecting space and equipment, use the Space & Equipment search field.
- To filter alarms by Point Category, select a category from the drop-down menu.
- To filter alarms by Network Items, select an item from the network tree.
Note: If you apply several filters, the filters are applied as AND statements. If you apply one filter with several conditions, the filters are applied as OR statements. For example, if you apply a filter for Alarm Type (High Alarm or Low Alarm) and a filter for Spaces & Equipment (AHU or VAV), the alarms filter for High Alarm or Low Alarm AND AHU or VAV. - Tap or click APPLY.
To clear all filters, tap or click Clear All.
How do I acknowledge or discard an alarm? How do I batch acknowledge or batch discard alarms?
- Select a single alarm entry or multiple alarms by tapping or clicking the check box next to the alarm or alarms.
- Tap or click ACTIONS and select Acknowledge.
- The Single Acknowledge window opens when you select one alarm. The Batch Acknowledge window opens when you select multiple alarms.
- To annotate your action, select a preset or enter your own
comment in the text box. Note: It is best practice to annotate your actions. When an Administrator chooses to enforce all annotations in the system settings, you have to annotate your actions.
- Tap or click ACKNOWLEDGE.
- Select a single alarm entry or multiple alarms by tapping or clicking the check box next to the alarm or alarms.
- Tap or click ACTIONS and select Discard.
- The Single Discard window opens when you select one alarm. The Batch Discard window opens when you select multiple alarms.
- To annotate your action, select a preset or enter your own
comment in the text box. Note: It is best practice to annotate your actions. When an Administrator chooses to enforce all annotations in the system settings, you have to annotate your actions.
- Tap or click DISCARD.
To remove alarms from the alarms list on a phone, you must acknowledge and then discard the alarms. After acknowledging and discarding the alarms, the alarms remain in the Acknowledged alarm count in the Alarm Summary. When you acknowledge or discard an alarm, you are acknowledging or discarding all previous occurrences of the alarm.
For batch actions, if multiple alarms are selected and the occurrences of the alarms exceed 10,000, the action takes place on the latest (by time occurred) occurrences.
How do I enable the silence icon so it appears in the Alarm Manager?
To enable the silence button in Alarm Manager, you must select the Enable Audible Alarm setting in the properties for the user in SMP. You must enable this setting for each user.
- Log in to SMP as an administrator user or the MetasysSysAgent user.
- Go to Tools > Administrator.
- In the Roles and Users pane, right-click on a user and select Properties.
- Select the User Profile tab.
- Select the Enable Audible Audio option.
- Click OK.
How do I silence alarms? Will silencing alarms silence current alarms or all alarms including new alarms?
To silence all current alarms, tap or click the loudspeaker button. Tapping or clicking the loudspeaker button silences the current alarms and any new occurrences of the alarm.
If a new alarm comes in while all existing alarms are silenced, the alarm sound plays until you acknowledge the alarm or silence the new alarm. To silence that alarm, tap or click the loudspeaker button.
Alarm sound plays for the highest priority alarm. If multiple alarms occur for different priorities, the sound for the highest priority alarm plays.
How do I configure the alarm sounds? How do I use custom files for the alarm sounds?
You can configure the alarm sounds in Metasys system preferences in SMP. To configure the alarm sounds (as well as alarm priorities), select the Alarm Settings tab in the Metasys system preferences. The alarm settings are system settings and therefore can be edited only by users authorized to edit system preferences. These alarm settings apply to SMP and the Metasys UI. SMP uses Wave (.wav) files for alarm sounds. MP3 files that are equivalent and similarly named to the .wav files are provided with the Metasys Server and Metasys UI install. The MP3 files used for alarm sounds are stored in C:\Program Files (x86)\Johnson Controls\Metasys UI\Client\audio on the Site Director.
To configure the alarm sounds, access SMP and refer to the Metasys Site Management Portal Help (LIT-1201793) or the Metasys UI Technical Bulletin (LIT-12012115).
To use a custom file for alarm sounds for the Metasys UI, you need both a Wave (.wav) file and an MP3 file in the system folders. Supported web browsers use the Wave (.wav) file. Place the custom Wave (.wav) file in C:\Program Files (x86)\Johnson Controls\MetasysIII\UI\audio. Place the custom MP3 in C:\Program Files (x86)\Johnson Controls\Metasys UI\Client\audio.
- The Alarm Settings tab controls the sounds made by the Metasys system when an alarm is received; however, the sound settings of the client computer control the volume of the audible alarms. If a sound file is missing or misconfigured, the Metasys system uses the default system beep in its place.
- If you use Metasys UI with Safari of MAC book v10.12.6, the alarm sound does not play, due to security updates in Safari, which prevent websites from playing audio and video without user consent or user action. You can change the Safari settings to play audio and video for all websites and thereby receive the alarm sound. Go to , and select Allow All Auto-Play from the drop-down. If you do not want to change this setting for all websites, you can select the Metasys website and select the same value for the individual website.
How do I view an annotation on an alarm?
- Tap or click on an alarm. The alarm details open. When an alarm occurrence has annotation to view, a page icon appears next to Annotations.
- Tap or click the page symbol. The
Annotations window opens. Note: Annotations added to an occurrence of an alarm do not appear in the annotations for a new occurrence of an alarm. To view annotations for a particular occurrence, tap or click the Annotations hyperlink with the page icon next to the occurrence.
How do I add an annotation to an alarm? How do I batch annotate?
- Select a single alarm entry or multiple alarms by tapping or clicking the check box next to the alarms.
- Tap or click ACTIONS in the upper left of the Alarm Manager.
- Select Annotate.
The Single Annotate window opens
when you select one alarm. The Batch
Annotate window opens when you select multiple alarms.
Note: You require the Manage Item Event permission for at least one authorization category to batch annotate alarms.
- Select a preset or enter your own comment in the text box.
- Tap or click ADD.
- Tap or click on an alarm. The alarm details open.
- Tap or click the
Annotations hyperlink. The Annotations window opens. Note: Annotations added to an occurrence of an alarm do not appear in the annotations for a new occurrence of an alarm. To add annotations for a particular occurrence, tap or click the Annotations hyperlink next to the occurrence.
- Tap or click the Add Annotation icon in the Annotations window.
- Select a preset or enter your own comment in the text box.
- Tap or click ADD.
Can I export or print the information that appears in the Alarm Manager and the Alarm Monitor?
You can export information that appears in the Alarm Manager and the Alarm Monitor only on a computer. The export function is not supported on tablets. The time displayed in the exported files displays the client time and not the server time.
To export information that appears in the Alarm Manager and the Alarm Monitor, click the export icon. You can export alarms to a .csv file and open the file in any supported spreadsheet software.
- Priority
- Type
- Trigger Value
- Equipment
- Name (of object in alarm)
- Occurred
- a snapshot image of the alarm summary and
- the displayed data
of the main area of the Alarm Manager or Alarm Monitor:
- Priority
- New
- Type
- Trigger Value
- Equipment
- Name (of object in alarm)
- Space
- # (the number of occurrences of the alarm)
- Occurred
Note: The .pdf export feature is not available when you are not logged in.
Are the Alarm Manager and the Alarm Monitor supported on all devices?
The Alarm Manager and Alarm Monitor are supported on tablet and computer platforms, but they are not supported on phone platforms.
